

CentremapsLIVE 2026: Bringing the Geospatial Community Together
A day of expert insight, practical learning, industry connections and fully CPD accredited! On 7 July 2026, we welcomed guests, suppliers and industry professionals to the first ever CentremapsLIVE event.
The aim was to bring people together, share knowledge and create an opportunity to explore the latest developments in OS NGD, CentremapsLive data suppliers, technology and services supporting the geospatial, planning, surveying and development sectors.
We had excellent feedback from both our guests and suppliers, with the event providing plenty of opportunities for conversations, demonstrations, presentations and knowledge sharing.
The event was also a CPD event, giving attendees the opportunity to learn from
specialists across the industry while continuing their professional development.
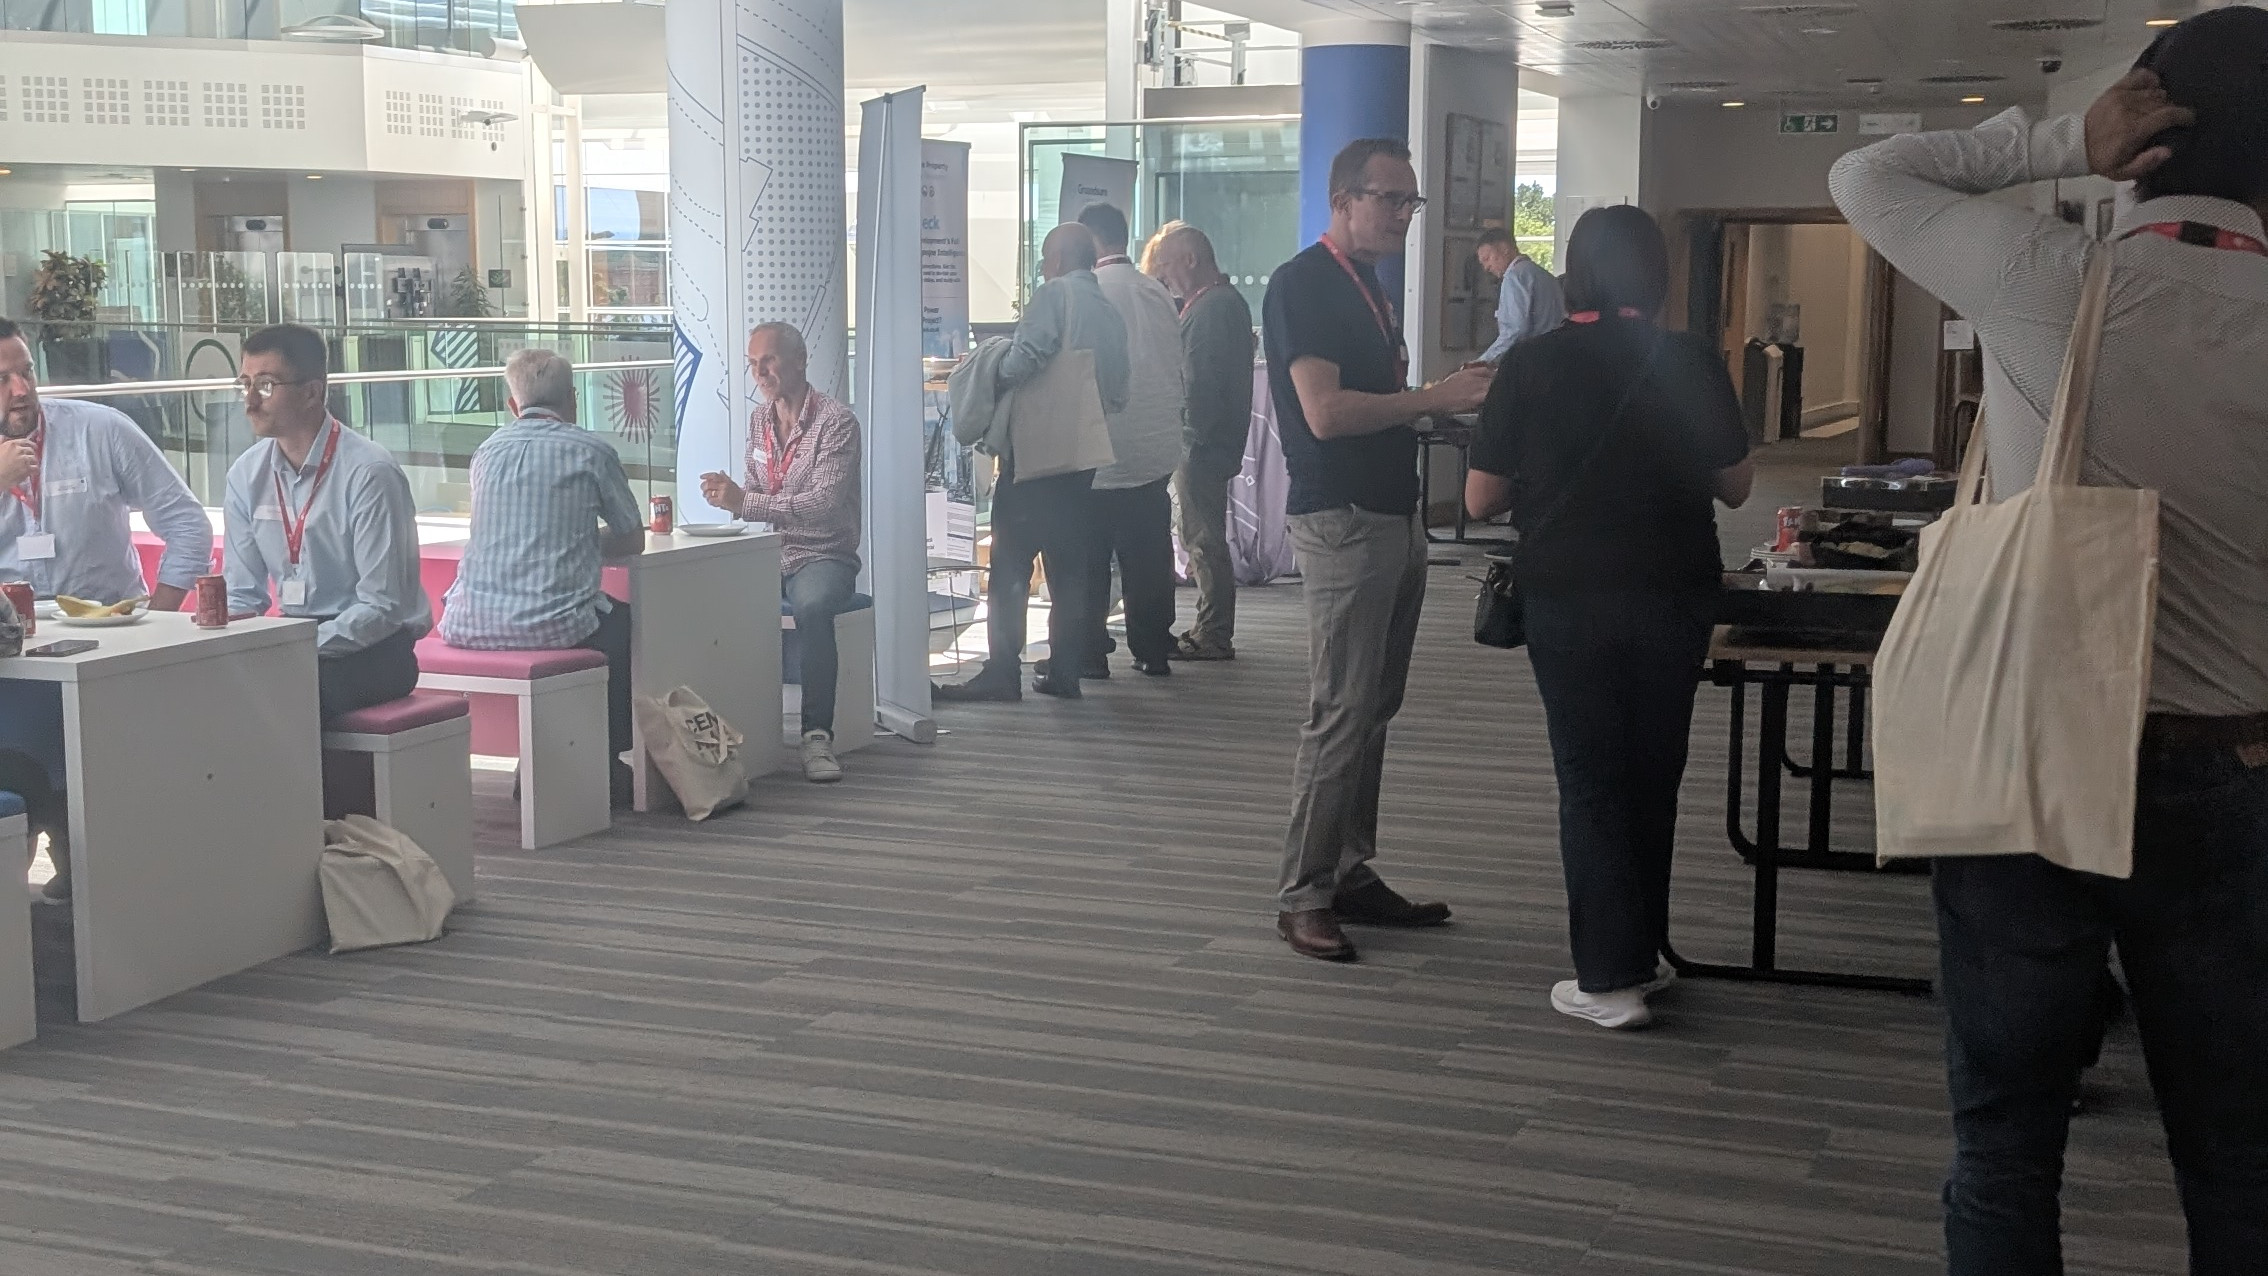
CentremapsLIVE was designed to be more than an opportunity to walk around stands and collect the obligatory tote bag upon arrival! We wanted to create an environment where attendees could understand how different data, technologies and services can be applied to real projects, where suppliers could share their expertise directly with the people working with these challenges every day and have the opportunity to gain feedback directly.
Our presentations were kicked off by Robert Wingfield, Senior Geospatial Consultant at Ordnance Survey, this showcase explores the capabilities of the Ordnance Survey National Geographic Database (OS NGD). The session highlights how the database delivers comprehensive, authoritative coverage across core themes including Addresses, Buildings, Land, Transport Networks, Water, Structures and Administrative Units. By linking these spatial layers, such as pairing Address points with Building footprints and Land Use data, analysts can perform advanced spatial modeling, precise proximity analysis and targeted land or property evaluations. Furthermore, rich attribution such as roof shapes, solar panel installations, building heights, floor counts and detailed land cover classifications provides unmatched depth for habitat mapping and infrastructure planning.
Robert's presentation shows how updated postcode area models cleanly align with building footprints to eliminate awkward spatial splits in geographic data. To help developers easily integrate OS NGD capabilities into their daily workflows, practical tools are available including tutorials, code samples and styling guides. You can watch the full recording of the session and register for upcoming live technical deep dives online today.
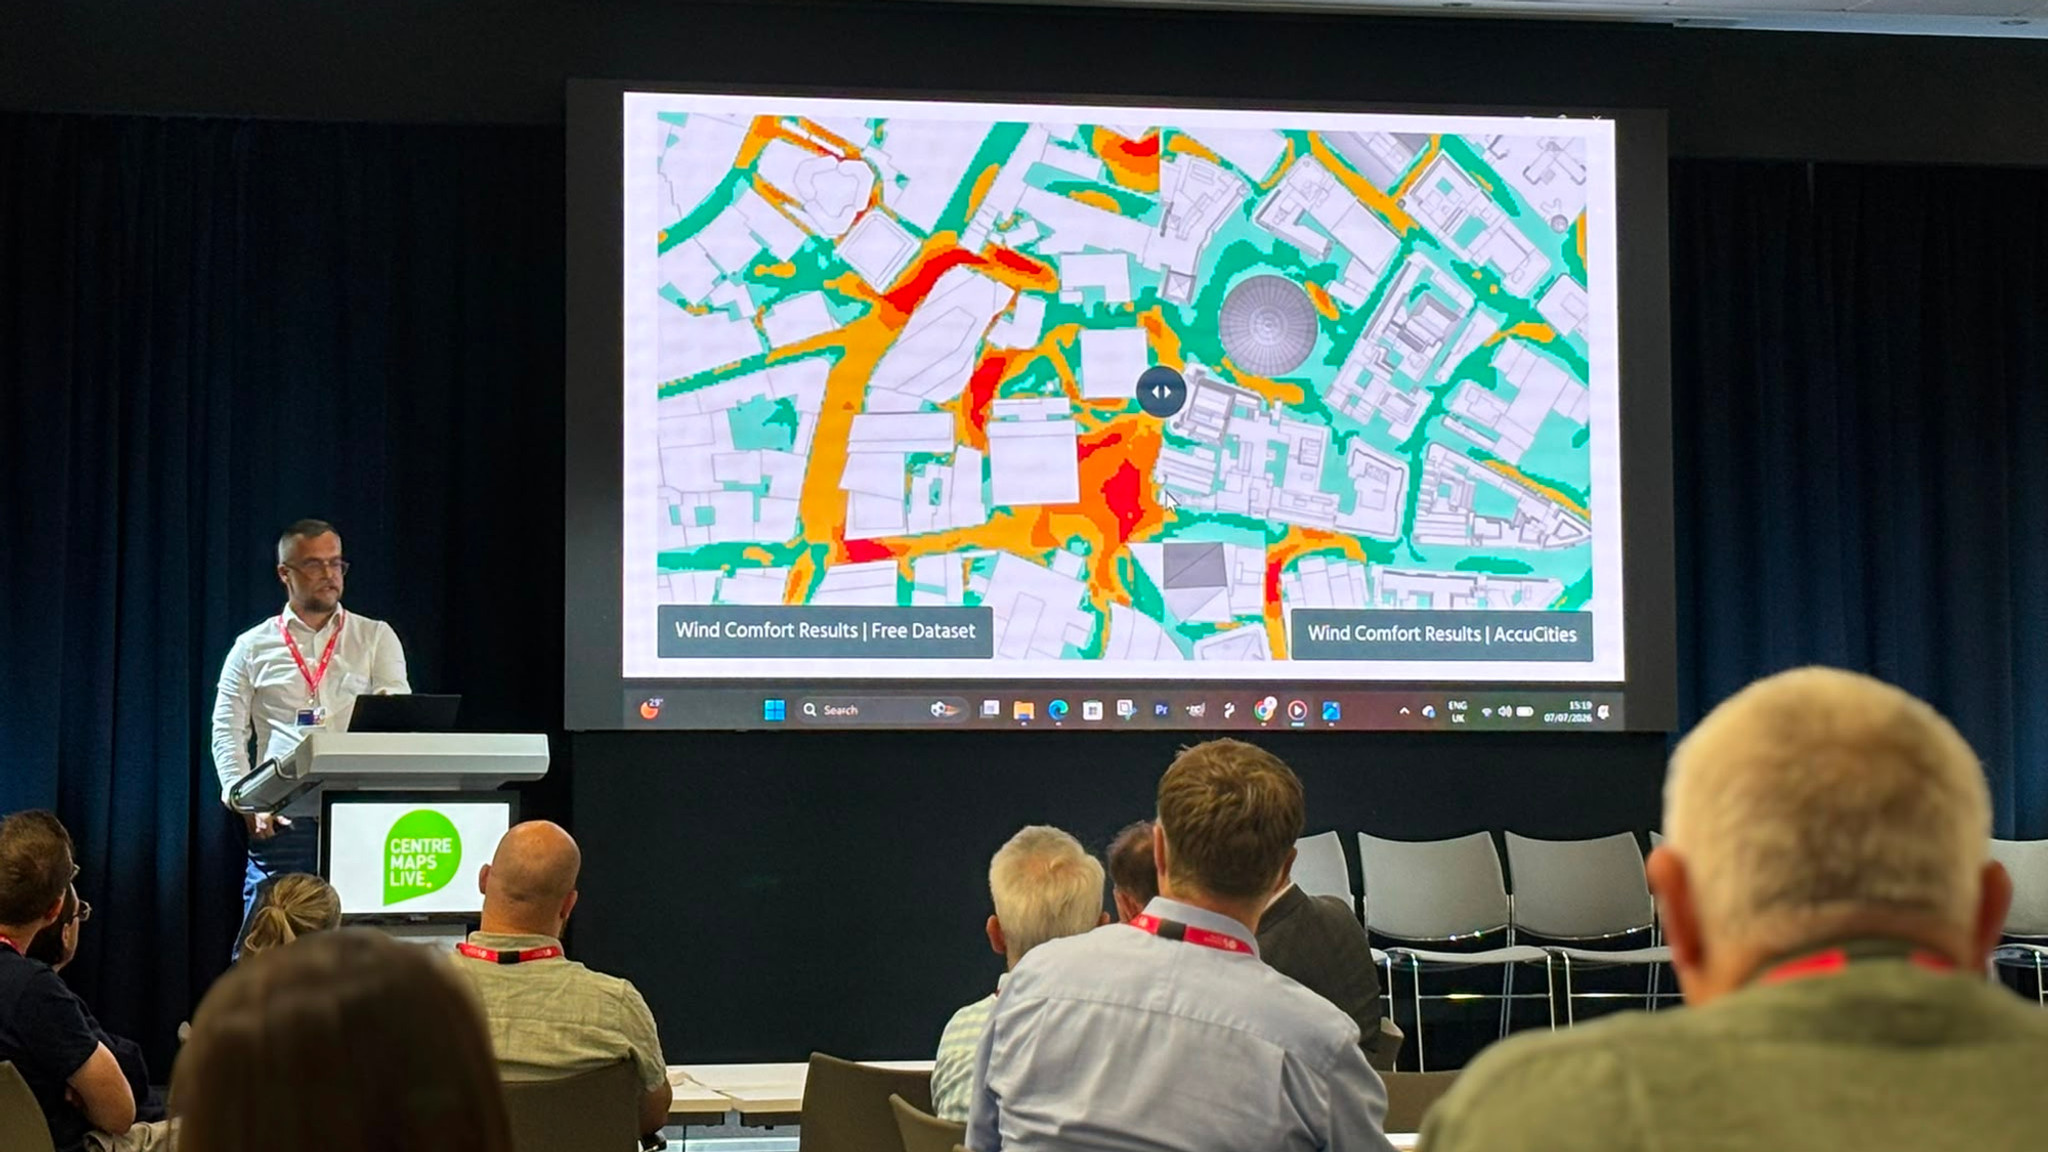
The presentations reflected that approach, covering everything from London's future skyline and 3D modelling to underground utilities, geological data, ground conditions, risk and development. Together, they demonstrated just how much information sits behind the decisions made when planning, designing and developing places and infrastructure.
One of the presentations explored the changing face of London through 3D mapping and modelling. AccuCities' Mapping London's Future Skyline presentation looked at the use of textured photogrammetry and specialist models to create detailed representations of London's built environment and its future development. It's a great example of how geospatial technology is moving well beyond traditional two dimensional mapping.
As our cities become more complex, being able to visualise buildings, development proposals and the surrounding environment in three dimensions can provide a much richer understanding of how places will look and interact in the future. The presentation provided a fascinating look at how detailed spatial data and modelling can help bring London's evolving skyline to life.

The Apogee presentation focused on another important part of the development lifecycle - understanding what's underground before work begins. Delivering clearer information with Apogee & Centremaps through utility searches, CDM reports, PoC reports and digitised fastviews. This presentation explored the role of utility information throughout the utility and development lifecycle, including rules and regulations, practical applications, case studies and consultancy. A key theme was the importance of identifying potential issues early.
The presentation covered HSG 47, which addresses avoiding danger from underground services, as well as PAS 128 and its different levels of survey information from records collation through to physical verification. The message was clear, better information at the beginning of a project can help reduce risk, avoid conflicts and potentially prevent expensive delays and redesigns later. Examples included projects affected by major gas mains, highlighting how underground infrastructure can have a significant impact on development costs, timescales and design decisions.
The British Geological Survey (BGS) presentation took us even further below ground. BGS Data Products introduced attendees to the work of BGS and its extensive range of geoscience data and information products. The presentation highlighted the sheer breadth of geological information available — from traditional geological mapping through to hazards, environmental information, infrastructure and emerging areas such as climate adaptation and energy.
One of the most striking themes was the potential cost of not understanding ground conditions.
The presentation explored a range of geohazards, including river erosion, shrink-swell clay subsidence, groundwater flooding and coastal erosion, demonstrating the financial and practical consequences that can arise when ground conditions aren't properly understood. For example, BGS highlighted that shrink-swell clay subsidence costs the UK economy more than £400 million each year, while unforeseen ground conditions can contribute to significant project delays and cost overruns.
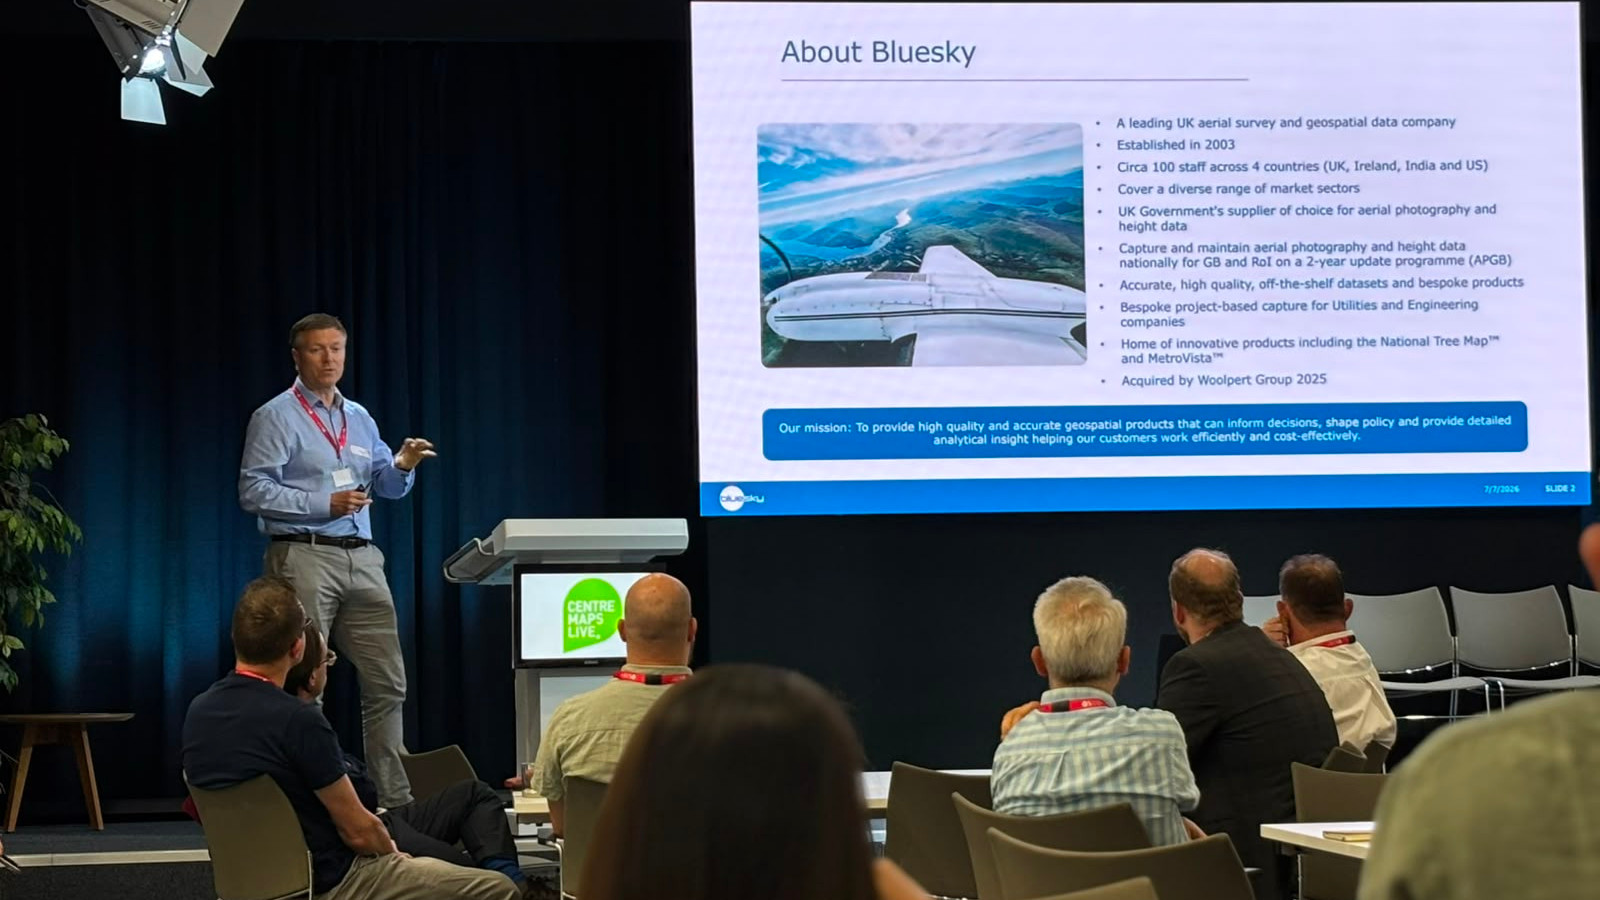
The presentation from Steve Johnson of Bluesky highlighted how AI and machine learning are being used to extract greater insight from aerial imagery and turn it into practical intelligence. One example is its Garden Surface Classification project, which has classified around two million gardens across London, identifying features such as trees, low vegetation, hard surfaces and vehicle occlusion. The work is now moving towards distinguishing porous and non-porous surfaces, with potential applications in understanding pluvial flooding and supporting urban planning.
Bluesky is also using AI for Urban Creep Analysis, identifying changes from green to grey surfaces across different aerial imagery. This can help inform drainage, flood risk and planning decisions, with the potential for wider use by utility companies and local authorities. Another area of development is Utility Cover Detection, using high resolution 5cm RGBI imagery to identify features such as drains, gullies and manholes. Testing across several UK locations has achieved detection rates of more than 80% for visible gullies and 75% for visible manholes, with further data being collected to improve the machine learning model.
Bluesky is also enhancing its National Tree Map™ through AI, improving tree segmentation and classification and developing outputs that distinguish between coniferous and deciduous trees, alongside ongoing species mapping trials. Together, these developments demonstrate how aerial imagery is evolving beyond traditional mapping to provide detailed, data driven intelligence for planning, infrastructure, environmental management and flood risk analysis.
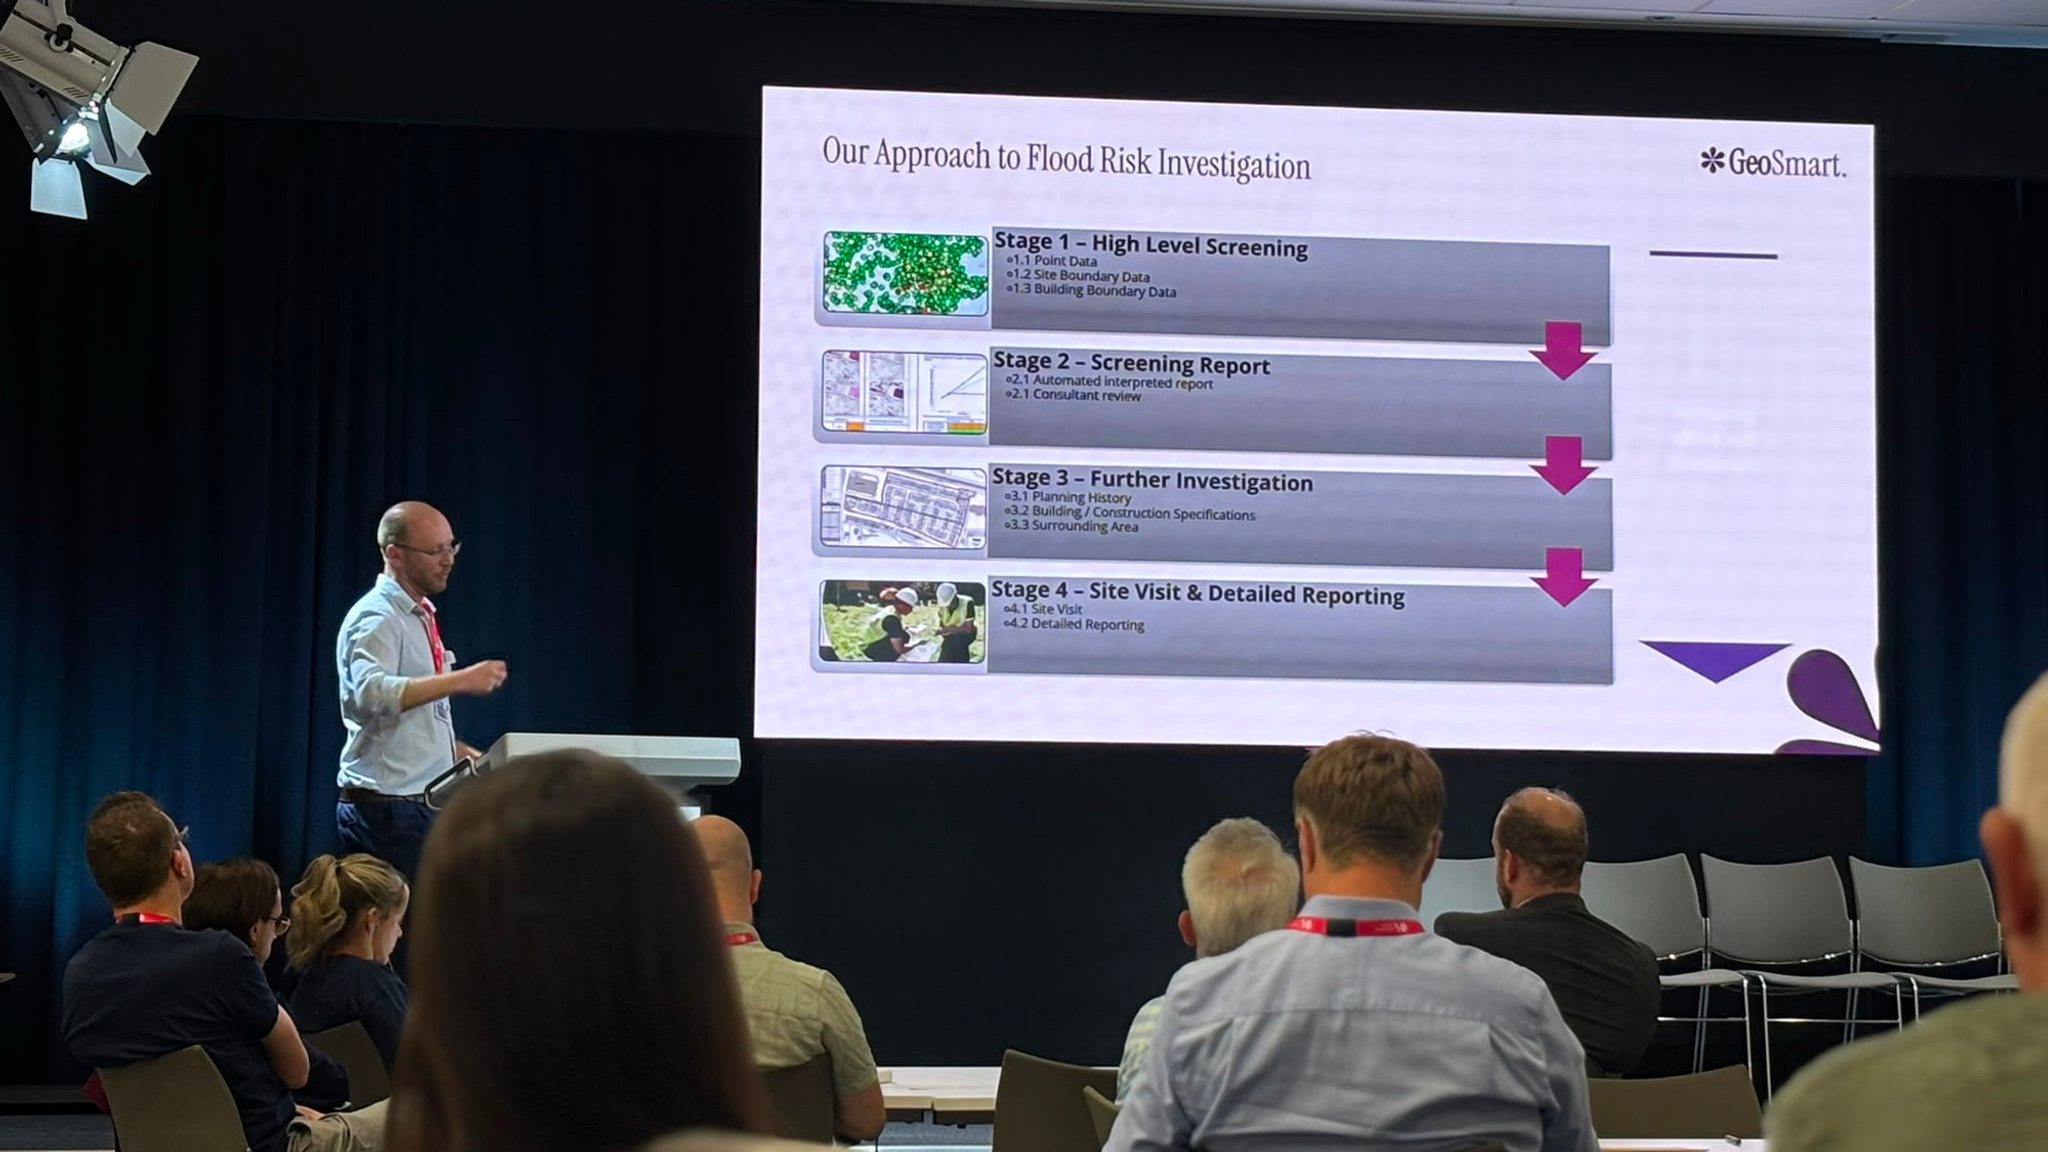
Paul Drury, Product Director at GeoSmart Information, explored how detailed geospatial data can help us better understand and assess flood risk. The session looked beyond traditional flood modelling, highlighting the importance of understanding pluvial, fluvial, coastal and groundwater flooding. Groundwater risk was a particular focus, with GeoSmart explaining why long duration flooding can present significant challenges for properties, infrastructure, insurers and lenders.
A key takeaway was the importance of how we represent a property when assessing risk. Using the same example, a buffered UPRN point indicated negligible risk, a building footprint showed very low risk, while assessing the full land title revealed a medium level of risk. This demonstrated how relying on a single point or building outline can potentially miss important surrounding risk. The presentation also demonstrated how OS NGD data supports GeoSmart’s analysis, using water features, buildings, transport networks, UPRNs and terrain data to create a more detailed picture of flood risk.
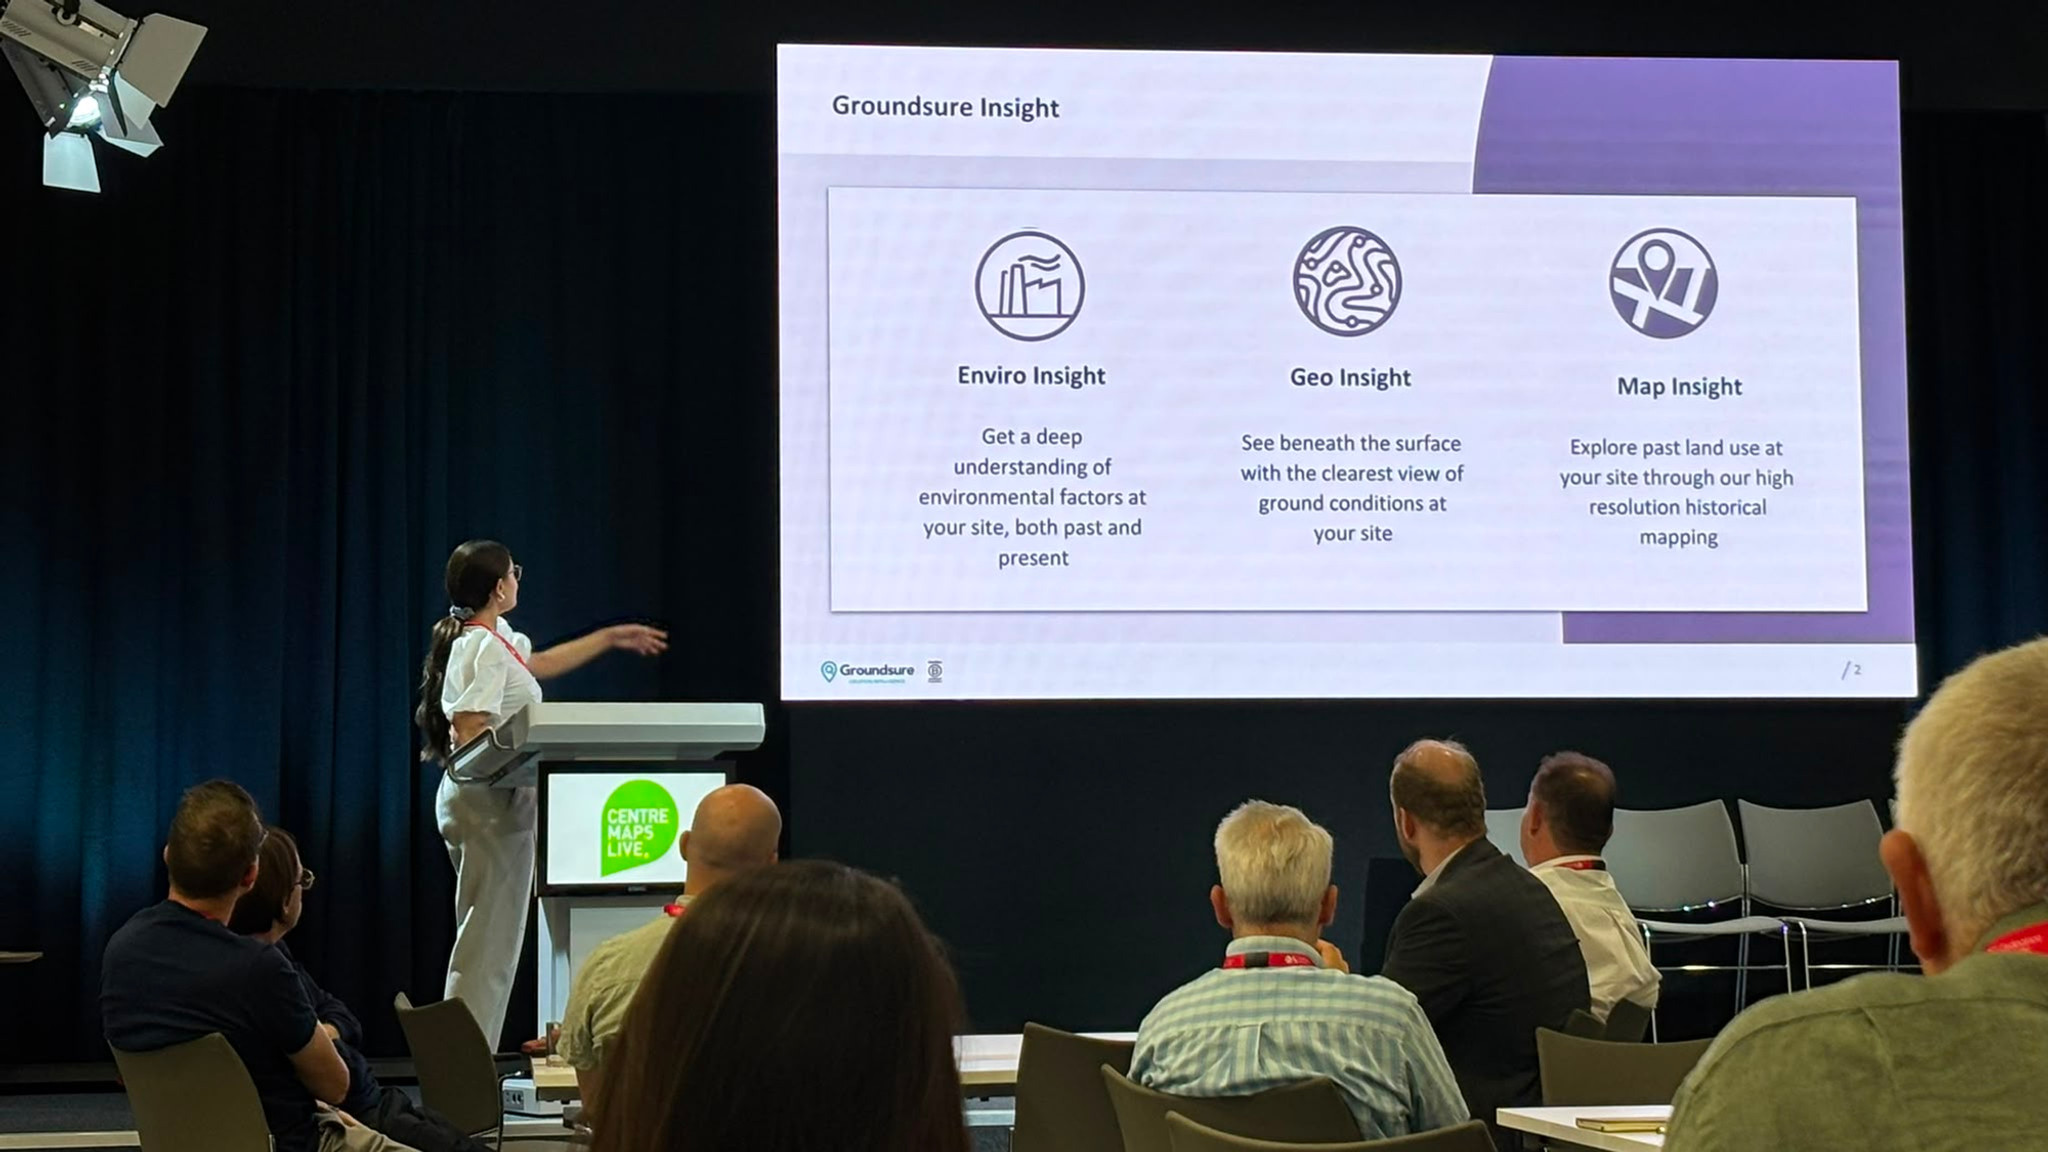
Jenna Whitfield, Business Development Executive at Groundsure, held a session centered on how environmental and geological data integrity drives accurate land assessment and development safety. The presentation highlighted the rigorous technical processes required to evaluate site hazards. Attendees were shown how over 300 datasets are actively managed and updated annually, to capture real time changes in contamination risks, hydrogeology, hydrology and urban planning constraints. Furthermore, high resolution historical mapping, digitised at over 500 DPI from sources dating back to the 1840s, plays a critical role in uncovering legacy industrial land uses, former underground tanks and unrecorded infrastructure.
Beyond standard environmental mapping, the session provided a deep dive into the specialised engineering and historical data needed to evaluate subsurface stability. Specialists in geology, history and mining highlighted how historical underground workings, sinkhole activity and specialised transport networks such as the 10.5 km Mail Rail tunnel network built between 1914 and 1917 present subtle yet critical structural considerations for modern projects.
Geo-Data Manager, Luke Clasper and Technical Director, Andrew Terry dive into the practical tools and technology shaping the industry, from new automated website assistants to seamless account invoicing and order re-routing. The presentation breaks down how to easily track data orders for complex projects using the reference and job title function, whilst reordering alternative mapping solutions for the same project area can be done with ease.
Beyond simple map purchasing, the talk highlights real world applications of data modeling and practical AI integration. Attendees were shown a large and detailed utility search and how the Fastview option can simplify this report into a visual, interactive PDF document for use across the team, in office and on site. They were also shown how database driven apportionment models help housing associations manage complex estate surface areas and transparently allocate resident service charges. Andrew Terry also demonstrated how AI and machine learning assist in scripting, prototyping and converting complex spatial datasets, such as Network Rail's linear hazard references into intuitive visual tools without relying on unvalidated AI outputs.

One of the key benefits of CentremapsLIVE was the opportunity for attendees to gain knowledge directly from specialists across the sector, but professional development doesn't have to stop when the event finishes. The event was a useful reminder that the map is often only the starting point- the real value comes from understanding the information behind it and using that information to make more informed decisions throughout your project workflow.
We've made the presentation videos available through our information portal, allowing attendees to revisit sessions, share with colleagues, catch up on anything they missed and continue building on the knowledge shared during the event. Please note, the videos are not CPD accredited. Whether you're particularly interested in 3D city modelling, underground utilities, geological data or the wider role of geospatial information in development, the recordings provide a valuable resource to return to.

Launching a new event always comes with a degree of uncertainty. Would people come? Would the sessions be useful? Would suppliers see value in being involved? Would the conversations continue beyond the exhibition stands? The feedback has answered those questions for us - CentremapsLIVE 2026 was a fantastic first event! Feedback highlighted many aspects of the day, including the interactive workshops, speaker sessions and Q&A panel.
The excellent response from both suppliers and guests has been incredibly encouraging, particularly because the event was built around collaboration and knowledge sharing. We're grateful to every supplier who contributed their time and expertise, to every speaker who shared their knowledge and to every guest who joined us, asked questions, made connections and helped create the atmosphere on the day.
This is just the beginning - the first CentremapsLIVE has given us plenty to build on. We've seen the appetite for an event that brings together people, data, technology and expertise, while providing genuine learning opportunities and valuable CPD.
The conversations started at the event don't have to end there. We encourage everyone who attended to take another look at the approved sessions, share them with colleagues and continue exploring the ideas and information presented.
If you weren't able to join us this time, the recordings are a great way to get a flavour of what CentremapsLIVE events are all about. Thank you to everyone who made CentremapsLIVE 2026 such a success - we look forward to seeing you all again at our next event(s!)


